
Datastories: clear, visually-stunning narratives about your business
When you need to make an important strategic decision for your business, how do you get buy-in from stakeholders?
Whether it’s your coworkers, leadership team, Board of Directors, investors, or the local community, telling your story clearly and efficiently is essential for earning trust and support.
That is especially true when:
It’s a complex story with a lot of data.
Your audience is a diverse mix of personality types, some who trust you and just want the big picture, and others who are skeptical and detail-oriented.
You have limited time to make your point.
Datastories are made for helping stakeholders understand your business.
Stories help all of us see, experience, and understand our world. With Datastories, we bring your organization’s story to life by presenting your audience with a visually-stunning, data-grounded narrative, weaving together a meaningful collection of images, video, description, infographics, and interactive data presented on maps.
Location Intelligence, Shared
Datastories are different from other presentation methods because they don’t force the viewer to wade through spreadsheets, tables, or charts. They show your data through a more familiar lens: a map. And in this case, the map is interactive, allowing the user to instantly see and understand their data in relationship to other variables.
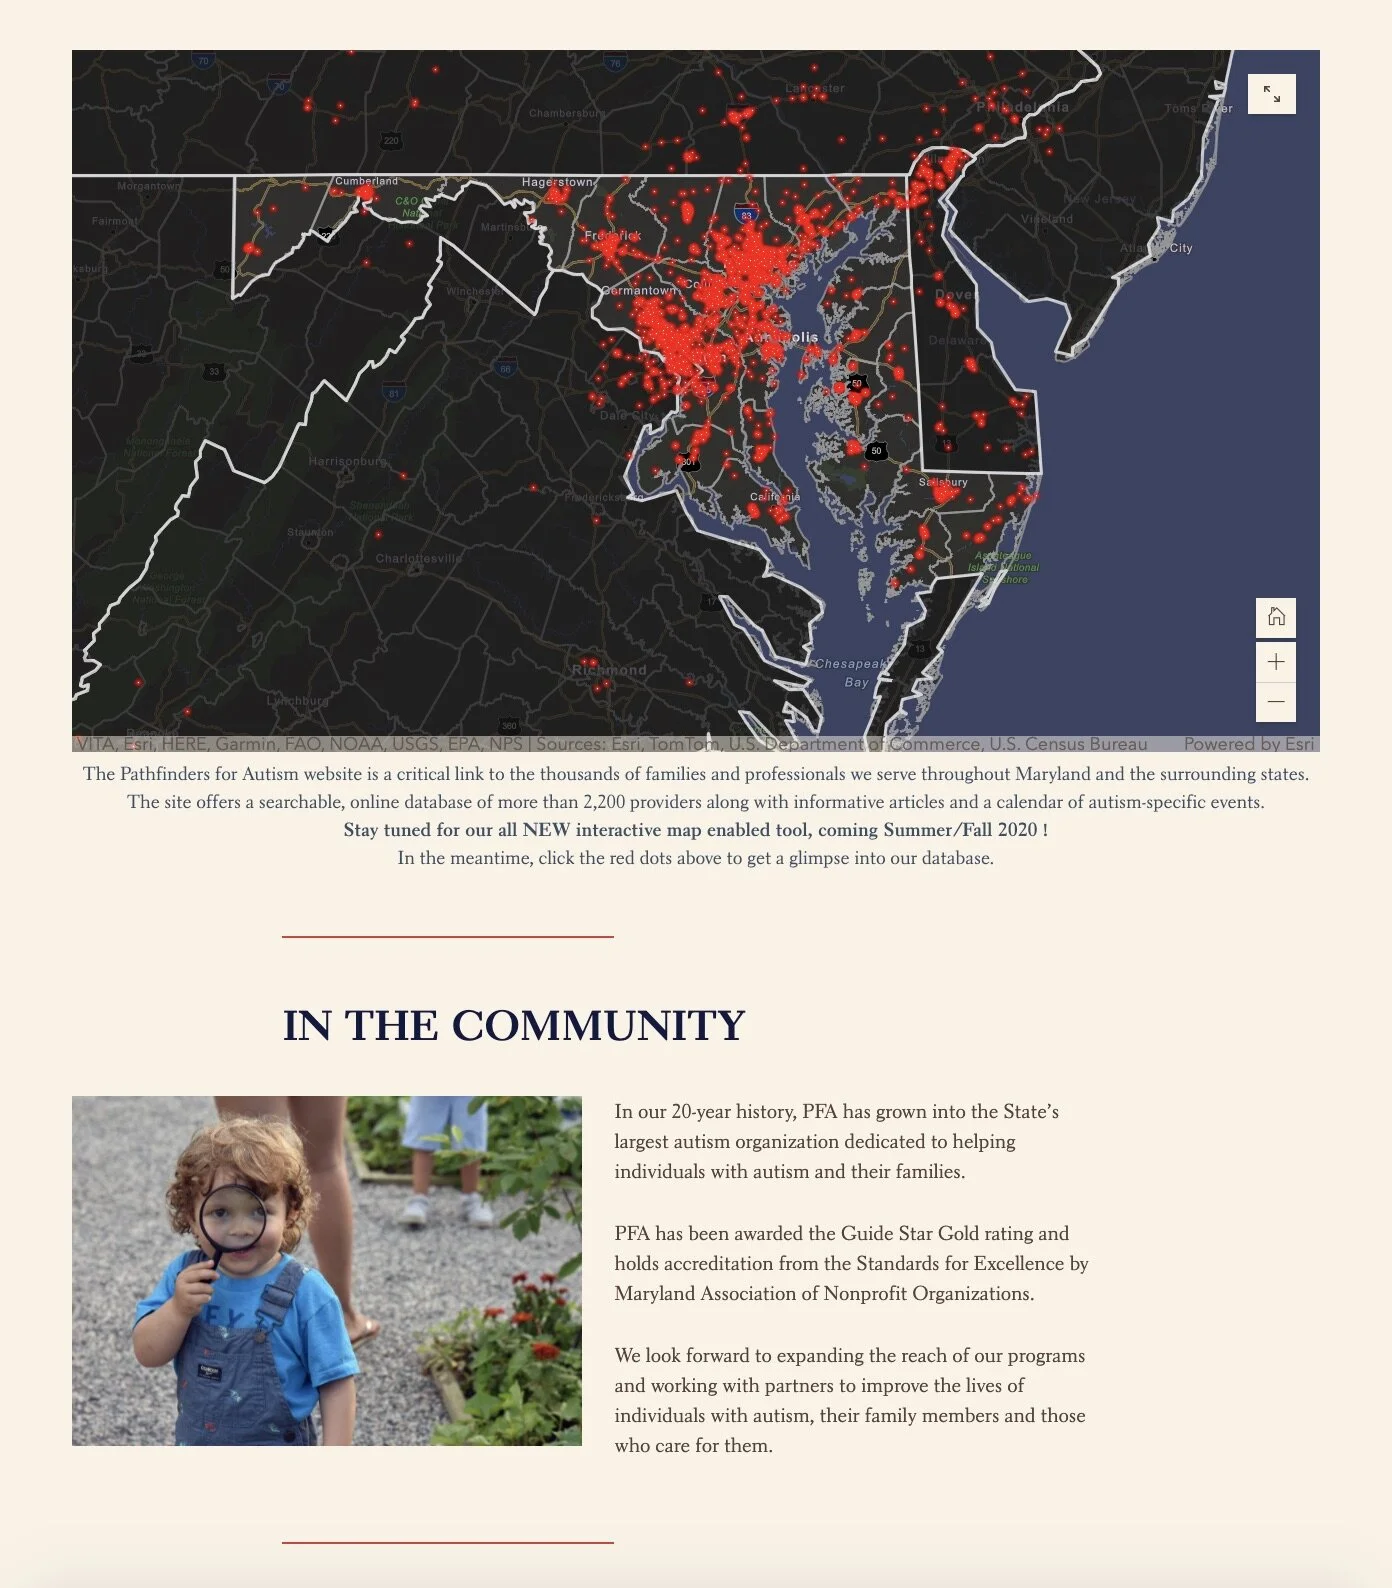
We worked with Pathfinders for Autism to help them showcase providers, partners, and other resources.

The Grand Central Partnership was able to show what it’s like to work, live, and play in Midtown East thanks to Datastory.
Serving a Diverse Audience
Each Datastory is crafted uniquely for the client, offering a balance of “autoplay” narrative and interactive content. The user can simply scroll down to reveal new insights about their data, or take a deeper dive into the interactive elements such as maps and infographics reports.
If your users only have time to grasp the big picture, all they have to do is scroll through the Datastory to take in key insights. And for those who want to poke and prod the data, they can dive in and work through the interactive maps and reports.
You can send it as a simple link in an email, embed it onto your website, or securely log in and present it on the boardroom wall. And if someone has a question that feels “off script” during that presentation, you’ll be ready to answer it because Datastories allow for direct access to their underlying data.
Tell Your Datastory Well
Our team uses Esri StoryMaps technology and award-winning expertise to give your data a voice through beautiful, data-grounded narratives. We’ve prepared Datastories for clients in a variety of industries, from nonprofits to local governments and even large multi-national corporations.
But this isn’t all we do at Datastory. We also created an app called MapDash that accompanies every Datastory, so that you always have a vast collection of data, reporting, and analytic tools at your fingertips. And if you need help finding the story you want to tell, we offer a wide range of location intelligence services.
Some of our best work is locked behind our clients’ secured environments, but click here to check out a gallery of some of our public-facing Datastories.